pip install pybrsaGetting Started with Turkish Banking Data
Introduction to the pybrsa package
The ‘pybrsa’ package facilitates programmatic access to Turkish banking sector data from the Turkish Banking Regulation and Supervision Agency (BRSA, known as BDDK in Turkish). The package provides R users with a clean interface to fetch monthly and quarterly banking statistics, financial reports, and sectoral indicators directly from BRSA’s official APIs. This vignette demonstrates a complete workflow: from discovering available data to fetching it and performing a basic analysis.
Installation and Setup
Install pybrsa from PyPI
Or install the development version from GitHub
pip install git+https://github.com/obakis/pybrsa.git# Import the package
import pybrsa
import pandas as pd
import matplotlib.pyplot as plt
import seaborn as sns
from datetime import datetime
# Set plot style
plt.style.use('seaborn-v0_8-whitegrid')
sns.set_palette("husl")Part 1: Discovering Available Data
Before requesting data, it’s useful to explore what tables and banking groups are available from BDDK’s two main portals. Both portals are official sources, but they organize the data differently:
- The Monthly Bulletin Portal provides high-level, summary reports designed for general consumption and quick overviews of monthly trends without any geographic coverage.
- The FinTurk Data System provides granular, detailed data, including statistics broken down by province, whereas the standard Monthly Bulletin offers national-level aggregates.
Important note: Currently, only a single grup_kod can be specified per request. The underlying BDDK API supports multiple grup_kod codes, and this functionality will be added in a future version.
Monthly Bulletin Tables
Monthly Bulletin provides high-level, national aggregate statistics.
# List available tables in the Monthly Bulletin
bulletin_tables = pybrsa.list_tables(source="bddk", lang="en")
print("## Monthly Bulletin Tables")
print(f"**Total tables available:** {len(bulletin_tables)}")
print("\n**First 10 tables:**")
display(bulletin_tables.head(10))

# List available banking groups for the Monthly Bulletin
bulletin_groups = pybrsa.list_groups(source="bddk", lang="en")
print("\n## Monthly Bulletin Banking Groups")
print(f"**Total groups available:** {len(bulletin_groups)}")
print("\n**First 10 groups:**")
display(bulletin_groups.head(10))
Available tables for bddk data:

 Table_No                            Title
        1                    Balance Sheet
        2                  Profit and Loss
        3                            Loans
        4                   Consumer Loans
        5       Sectoral Loan Distribution
        6                        SME Loans
        7 Syndication Securitization Loans
        8                       Securities
        9                 Deposits by Type
       10             Deposits by Maturity
       11               Liquidity Position
       12                 Capital Adequacy
       13        Foreign Currency Position
       14   Off-Balance Sheet Transactions
       15                           Ratios
       16                Other Information
       17            Foreign Branch Ratios
## Monthly Bulletin Tables
**Total tables available:** 17

**First 10 tables:**| Table_No | Title | |
|---|---|---|
| 0 | 1 | Balance Sheet |
| 1 | 2 | Profit and Loss |
| 2 | 3 | Loans |
| 3 | 4 | Consumer Loans |
| 4 | 5 | Sectoral Loan Distribution |
| 5 | 6 | SME Loans |
| 6 | 7 | Syndication Securitization Loans |
| 7 | 8 | Securities |
| 8 | 9 | Deposits by Type |
| 9 | 10 | Deposits by Maturity |
Available banking groups for bddk data:

 Group_Code                             Name
      10001                     Sector Total
      10002                    Deposit Banks
      10008       Deposit - Domestic Private
      10009                 Deposit - Public
      10010                Deposit - Foreign
      10003              Participation Banks
      10004 Development and Investment Banks
      10005           Domestic Private Banks
      10006                     Public Banks
      10007                    Foreign Banks

## Monthly Bulletin Banking Groups
**Total groups available:** 10

**First 10 groups:**| Group_Code | Name | |
|---|---|---|
| 0 | 10001 | Sector Total |
| 1 | 10002 | Deposit Banks |
| 2 | 10008 | Deposit - Domestic Private |
| 3 | 10009 | Deposit - Public |
| 4 | 10010 | Deposit - Foreign |
| 5 | 10003 | Participation Banks |
| 6 | 10004 | Development and Investment Banks |
| 7 | 10005 | Domestic Private Banks |
| 8 | 10006 | Public Banks |
| 9 | 10007 | Foreign Banks |
FinTurk Tables
FinTurk system provides more granular data, including provincial breakdowns.
# List available tables in FinTurk
finturk_tables = pybrsa.list_tables(source="finturk", lang="en")
print("## FinTurk Tables")
print(f"**Total tables available:** {len(finturk_tables)}")
print("\n**First 10 tables:**")
display(finturk_tables.head(10))

# List available banking groups for FinTurk
finturk_groups = pybrsa.list_groups(source="finturk", lang="en")
print("\n## FinTurk Banking Groups")
print(f"**Total groups available:** {len(finturk_groups)}")
print("\n**First 10 groups:**")
display(finturk_groups.head(10))

# List of cities for FinTurk
cities = pybrsa.list_cities()
print("\n## Available Cities")
print(f"**Total cities:** {len(cities)}")
print("\n**First 10 cities:**")
display(cities.head(10))
Available tables for finturk data:

 Table_No                                        Title
        1                          Loans (Thousand TL)
        2                       Deposits (Thousand TL)
        3                 Retail Banking (Thousand TL)
        4        Selected Sectoral Loans (Thousand TL)
        5                                   Ratios (%)
        6 Branches and Distribution by Population (TL)
        7   Gold Loans and Gold Deposits (Thousand TL)
## FinTurk Tables
**Total tables available:** 7

**First 10 tables:**| Table_No | Title | |
|---|---|---|
| 0 | 1 | Loans (Thousand TL) |
| 1 | 2 | Deposits (Thousand TL) |
| 2 | 3 | Retail Banking (Thousand TL) |
| 3 | 4 | Selected Sectoral Loans (Thousand TL) |
| 4 | 5 | Ratios (%) |
| 5 | 6 | Branches and Distribution by Population (TL) |
| 6 | 7 | Gold Loans and Gold Deposits (Thousand TL) |
Available banking groups for finturk data:

 Group_Code                             Name
      10001                     Sector Total
      10002                    Deposit Banks
      10003 Development and Investment Banks
      10004              Participation Banks
      10005                    Foreign Banks
      10006                     Public Banks
      10007           Domestic Private Banks

## FinTurk Banking Groups
**Total groups available:** 7

**First 10 groups:**| Group_Code | Name | |
|---|---|---|
| 0 | 10001 | Sector Total |
| 1 | 10002 | Deposit Banks |
| 2 | 10003 | Development and Investment Banks |
| 3 | 10004 | Participation Banks |
| 4 | 10005 | Foreign Banks |
| 5 | 10006 | Public Banks |
| 6 | 10007 | Domestic Private Banks |
Available cities for Finturk quarterly data
Use license plate number (plaka) in fetch_finturk functions:
Valid values: 0 (HEPSI/ALL), 1-81, 999 (YURT DISI/ABROAD)

 plaka             il
     0          HEPSİ
     1          ADANA
     2       ADIYAMAN
     3 AFYONKARAHİSAR
     4           AĞRI
     5         AMASYA
     6         ANKARA
     7        ANTALYA
     8         ARTVİN
     9          AYDIN
    10      BALIKESİR
    11        BİLECİK
    12         BİNGÖL
    13         BİTLİS
    14           BOLU
    15         BURDUR
    16          BURSA
    17      ÇANAKKALE
    18        ÇANKIRI
    19          ÇORUM
    20        DENİZLİ
    21     DİYARBAKIR
    22         EDİRNE
    23         ELAZIĞ
    24       ERZİNCAN
    25        ERZURUM
    26      ESKİŞEHİR
    27      GAZİANTEP
    28        GİRESUN
    29      GÜMÜŞHANE
    30        HAKKARİ
    31          HATAY
    32        ISPARTA
    33         MERSİN
    34       İSTANBUL
    35          İZMİR
    36           KARS
    37      KASTAMONU
    38        KAYSERİ
    39     KIRKLARELİ
    40       KIRŞEHİR
    41        KOCAELİ
    42          KONYA
    43        KÜTAHYA
    44        MALATYA
    45         MANİSA
    46  KAHRAMANMARAŞ
    47         MARDİN
    48          MUĞLA
    49            MUŞ
    50       NEVŞEHİR
    51          NİĞDE
    52           ORDU
    53           RİZE
    54        SAKARYA
    55         SAMSUN
    56          SİİRT
    57          SİNOP
    58          SİVAS
    59       TEKİRDAĞ
    60          TOKAT
    61        TRABZON
    62        TUNCELİ
    63      ŞANLIURFA
    64           UŞAK
    65            VAN
    66         YOZGAT
    67      ZONGULDAK
    68        AKSARAY
    69        BAYBURT
    70        KARAMAN
    71      KIRIKKALE
    72         BATMAN
    73         ŞIRNAK
    74         BARTIN
    75        ARDAHAN
    76          IĞDIR
    77         YALOVA
    78        KARABÜK
    79          KİLİS
    80       OSMANİYE
    81          DÜZCE
   999      YURT DIŞI

## Available Cities
**Total cities:** 83

**First 10 cities:**| plaka | il | |
|---|---|---|
| 0 | 0 | HEPSİ |
| 1 | 1 | ADANA |
| 2 | 2 | ADIYAMAN |
| 3 | 3 | AFYONKARAHİSAR |
| 4 | 4 | AĞRI |
| 5 | 5 | AMASYA |
| 6 | 6 | ANKARA |
| 7 | 7 | ANTALYA |
| 8 | 8 | ARTVİN |
| 9 | 9 | AYDIN |
Part 2: Fetching Monthly Bulletin Data
Let’s fetch “Table 4: Consumer Loans” for public banks (grup_kod = 10006) between January 2020 and December 2020.
# Fetch data from Monthly Bulletin
my_dat = pybrsa.fetch_bddk(
    start_year=2020,
    start_month=1,
    end_year=2020,
    end_month=12,
    table_no=4,
    grup_kod=10001,
    verbose=True
)

print(f"**Dataset dimensions:** {my_dat.shape}")
print(f"**Dataset columns:** {list(my_dat.columns)}")
print("\n**First 5 rows:**")
display(my_dat.head())
Fetching table 4 for 12 months: 2020-01 to 2020-12
[1/12] 2020-01... 41 rows
[2/12] 2020-02... 41 rows
[3/12] 2020-03... 41 rows
[4/12] 2020-04... 41 rows
[5/12] 2020-05... 41 rows
[6/12] 2020-06... 41 rows
[7/12] 2020-07... 41 rows
[8/12] 2020-08... 41 rows
[9/12] 2020-09... 41 rows
[10/12] 2020-10... 41 rows
[11/12] 2020-11... 41 rows
[12/12] 2020-12... 41 rows
**Dataset dimensions:** (492, 10)
**Dataset columns:** ['group_name', 'BasitSira', 'Ad', 'BasitFont', 'TRY', 'FX', 'Total', 'grup_kod', 'period', 'currency']
**First 5 rows:**| group_name | BasitSira | Ad | BasitFont | TRY | FX | Total | grup_kod | period | currency | |
|---|---|---|---|---|---|---|---|---|---|---|
| 0 | Banking Sector | 1 | Consumer Loans (2+3+4) | bold | 480482 | 82 | 480564 | 10001 | 2020-01 | TL |
| 1 | Banking Sector | 2 | Consumer Loans - Housing | 202648 | 46 | 202694 | 10001 | 2020-01 | TL | |
| 2 | Banking Sector | 3 | Consumer Loans - Vehicle | 6979 | 0 | 6979 | 10001 | 2020-01 | TL | |
| 3 | Banking Sector | 4 | Consumer Loans - Personal Finance | 270855 | 36 | 270892 | 10001 | 2020-01 | TL | |
| 4 | Banking Sector | 5 | Consumer Loans - Fx Indexed (6+7+8) | bold | 65 | 0 | 65 | 10001 | 2020-01 | TL |
Let’s compare “Consumer Loans - Housing” and “Consumer Loans - Personal Finance” over time.
# Filter and prepare data for visualization
if 'Ad' in my_dat.columns and 'TRY' in my_dat.columns and 'period' in my_dat.columns:
    # Filter for specific loan types
    cols_to_keep = ["Consumer Loans - Housing", "Consumer Loans - Personal Finance"]
    filtered_data = my_dat[my_dat['Ad'].isin(cols_to_keep)].copy()

    # Convert period to datetime
    filtered_data['date'] = pd.to_datetime(filtered_data['period'] + '-01', format='%Y-%m-%d')

    # Create the plot
    fig, ax = plt.subplots(figsize=(10, 6))

    # Plot each loan type
    for loan_type in cols_to_keep:
        loan_data = filtered_data[filtered_data['Ad'] == loan_type]
        ax.plot(loan_data['date'], loan_data['TRY'],
                marker='o', linewidth=2, markersize=6, label=loan_type)

    # Format x-axis
    ax.xaxis.set_major_locator(plt.matplotlib.dates.MonthLocator(interval=2))
    ax.xaxis.set_major_formatter(plt.matplotlib.dates.DateFormatter('%b %Y'))
    plt.xticks(rotation=45, ha='right')

    # Format y-axis
    ax.yaxis.set_major_formatter(plt.matplotlib.ticker.StrMethodFormatter('{x:,.0f}'))

    # Add labels and title
    ax.set_title('Consumer Loans Trends, Jan 2020-Dec 2020 (TRY)', fontsize=14, fontweight='bold')
    ax.set_xlabel('')
    ax.set_ylabel('TRY (millions)')
    ax.legend(loc='upper left', bbox_to_anchor=(1, 1))
    ax.grid(True, alpha=0.3)

    plt.tight_layout()
    plt.show()

    print(f"**Summary statistics for selected loan types:**")
    summary_stats = filtered_data.groupby('Ad')['TRY'].agg(['mean', 'min', 'max', 'std']).round(2)
    display(summary_stats)
else:
    print("Required columns not found in the dataset")
**Summary statistics for selected loan types:**| mean | min | max | std | |
|---|---|---|---|---|
| Ad | ||||
| Consumer Loans - Housing | 243789.00 | 202648 | 279527 | 33553.41 |
| Consumer Loans - Personal Finance | 340054.25 | 270855 | 385882 | 42641.89 |
Part 3: Fetching Granular FinTurk Data
Now let’s explore the more detailed FinTurk data. We’ll fetch “Table 2: Deposits” for all banks (grup_kod = 10001), all provinces over 2023 and 2024.
# Fetch data from FinTurk
my_dat2 = pybrsa.fetch_finturk(
    start_year=2023,
    start_month=3,
    end_year=2024,
    end_month=12,
    table_no=2,
    grup_kod=10001,
    il=0,  # 0 means all provinces
    verbose=False
)

print(f"**Dataset dimensions:** {my_dat2.shape}")
print(f"**Dataset columns:** {list(my_dat2.columns)}")
print("\n**First 5 rows:**")
display(my_dat2.head())
**Dataset dimensions:** (656, 15)
**Dataset columns:** ['grup_kod', 'Yıl', 'Ay', 'il_adi', 'Grup', 'Tasarruf Mevduatı', 'Tasarruf Mevduatı (TL)', 'Tasarruf Mevduatı (DTH)', 'Diğer Mevduat', 'Diğer Mevduat (TL)', 'Diğer Mevduat (DTH)', 'Toplam Mevduat', 'plaka', 'period', 'table_no']
**First 5 rows:**| grup_kod | Yıl | Ay | il_adi | Grup | Tasarruf Mevduatı | Tasarruf Mevduatı (TL) | Tasarruf Mevduatı (DTH) | Diğer Mevduat | Diğer Mevduat (TL) | Diğer Mevduat (DTH) | Toplam Mevduat | plaka | period | table_no | |
|---|---|---|---|---|---|---|---|---|---|---|---|---|---|---|---|
| 0 | 10001 | 2023 | 3 | ADANA | SEKTÖR | 101555827 | 68165445 | 33390382 | 40948954 | 29321746 | 11627208 | 142504781 | 1 | 2023-03 | 2 |
| 1 | 10001 | 2023 | 3 | ADIYAMAN | SEKTÖR | 14189512 | 8769470 | 5420042 | 4133270 | 3422143 | 711127 | 18322782 | 2 | 2023-03 | 2 |
| 2 | 10001 | 2023 | 3 | AFYONKARAHİSAR | SEKTÖR | 26182581 | 13630002 | 12552579 | 7218373 | 5476164 | 1742209 | 33400954 | 3 | 2023-03 | 2 |
| 3 | 10001 | 2023 | 3 | AĞRI | SEKTÖR | 4541209 | 2860903 | 1680306 | 1495488 | 1246086 | 249402 | 6036697 | 4 | 2023-03 | 2 |
| 4 | 10001 | 2023 | 3 | AKSARAY | SEKTÖR | 22535449 | 10411079 | 12124370 | 4662855 | 3259852 | 1403003 | 27198304 | 68 | 2023-03 | 2 |
FinTurk data includes a province column (il). Let’s examine the share of selected provinces in total deposits ove 2020-2024 period.
if 'il_adi' in my_dat2.columns and 'period' in my_dat2.columns and 'Toplam Mevduat' in my_dat2.columns:
    # Select provinces of interest
    sel_cities = ["ADANA", "MALATYA", "MUĞLA", "KAYSERİ"]

    # Prepare data
    plot_data = my_dat2[['il_adi', 'period', 'Toplam Mevduat']].copy()
    plot_data = plot_data.rename(columns={'il_adi': 'city', 'Toplam Mevduat': 'deposit'})

    # Convert period to datetime
    plot_data['date'] = pd.to_datetime(plot_data['period'] + '-01', format='%Y-%m-%d')

    # Filter for selected cities
    plot_data = plot_data[plot_data['city'].isin(sel_cities)]

    # Calculate total deposits per period
    total_deposits = my_dat2.groupby('period')['Toplam Mevduat'].sum().reset_index()
    total_deposits = total_deposits.rename(columns={'Toplam Mevduat': 'total_deposit'})

    # Merge and calculate share
    plot_data = pd.merge(plot_data, total_deposits, on='period')
    plot_data['share'] = (plot_data['deposit'] / plot_data['total_deposit']) * 100

    # Create the plot
    fig, ax = plt.subplots(figsize=(10, 6))

    # Plot each city
    for city in sel_cities:
        city_data = plot_data[plot_data['city'] == city]
        ax.plot(city_data['date'], city_data['share'],
                marker='o', linewidth=2, markersize=6, label=city)

    # Format x-axis
    ax.xaxis.set_major_locator(plt.matplotlib.dates.MonthLocator(interval=3))
    ax.xaxis.set_major_formatter(plt.matplotlib.dates.DateFormatter('%b %Y'))
    plt.xticks(rotation=45, ha='right')

    # Add labels and title
    ax.set_title('Share of Selected Provinces in Deposits, 2023-2024 (%)', fontsize=14, fontweight='bold')
    ax.set_xlabel('')
    ax.set_ylabel('Share (%)')
    ax.legend(loc='upper left', bbox_to_anchor=(1, 1))
    ax.grid(True, alpha=0.3)

    plt.tight_layout()
    plt.show()

    # Show summary statistics
    print(f"**Average deposit share by province (2023-2024):**")
    avg_shares = plot_data.groupby('city')['share'].mean().sort_values(ascending=False).round(3)
    display(avg_shares.to_frame('Average Share (%)'))
else:
    print("Required columns not found in the dataset")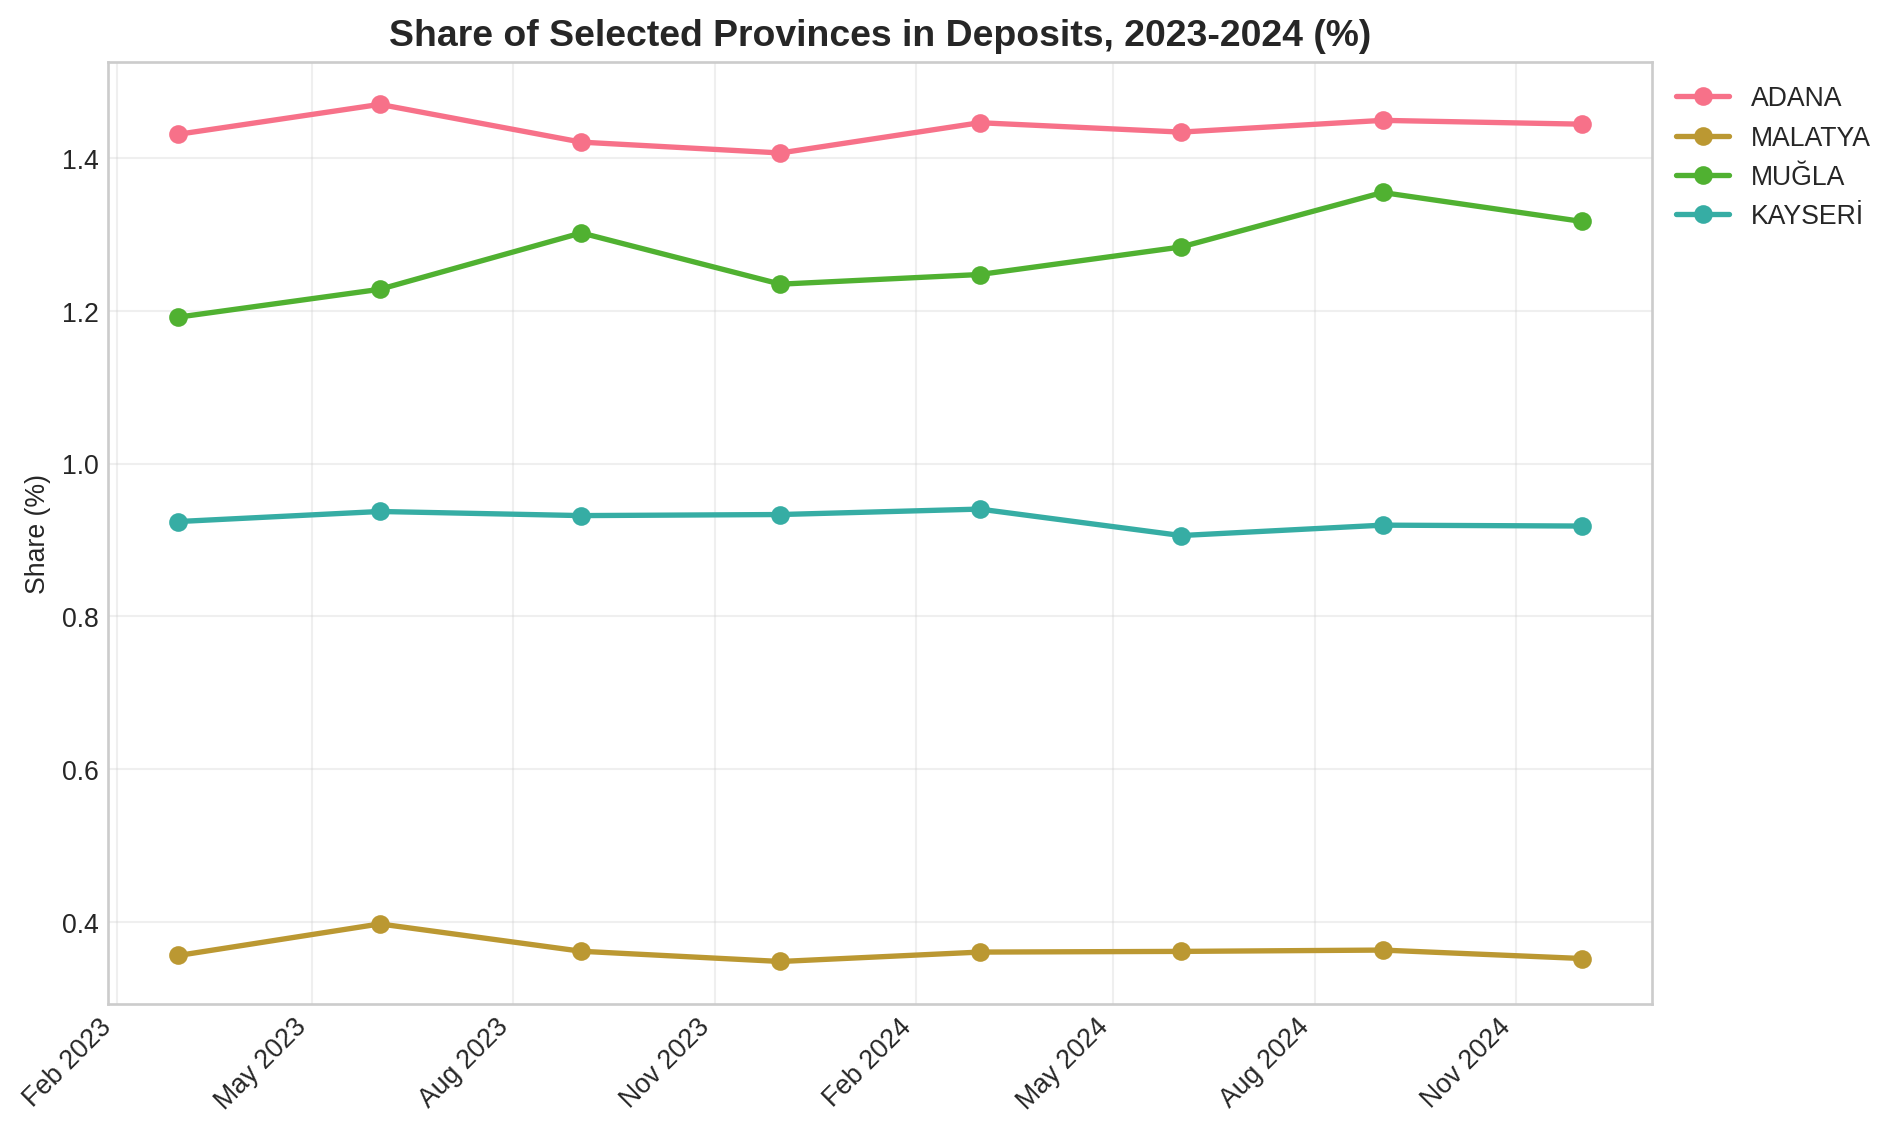
**Average deposit share by province (2023-2024):**Part 4: Saving Your Results
The save_data() function allows you to export results in various formats for use in other tools.
import pybrsa
import tempfile

# Save to different formats
pybrsa.save_data(my_dat, "filename_you_prefer", format="csv")
pybrsa.save_data(my_dat, "filename_you_prefer", format="pkl")
pybrsa.save_data(my_dat, "filename_you_prefer", format="xlsx")

# Save to Parquet
my_dat.to_parquet("filename_you_prefer.parquet", index=False)

# With tempfile
temp_path = pybrsa.tempfile_base()
pybrsa.save_data(my_dat, temp_path, format="csv")
print(f"Data saved to: {temp_path}.csv")
Next Steps
This vignette demonstrated the basic workflow of the pyrbrs package. To learn more:
- Explore all functions in the package API reference
- Try different tables and banking groups using
list_tables()andlist_groups(). - Check out the
rbrsapackage for similar functionality in R.